Sustainability: Kinder, Cleaner, Greener Dairy
Kinder, Cleaner, Greener Dairy
Is dairy from fermentation really more sustainable than dairy from cows? Scroll to see our climate footprint, and find out for yourself!


Our climate footprint
We calculated the environmental impact of Bored Cow from farm to factory, and compared it to traditional dairy milk.
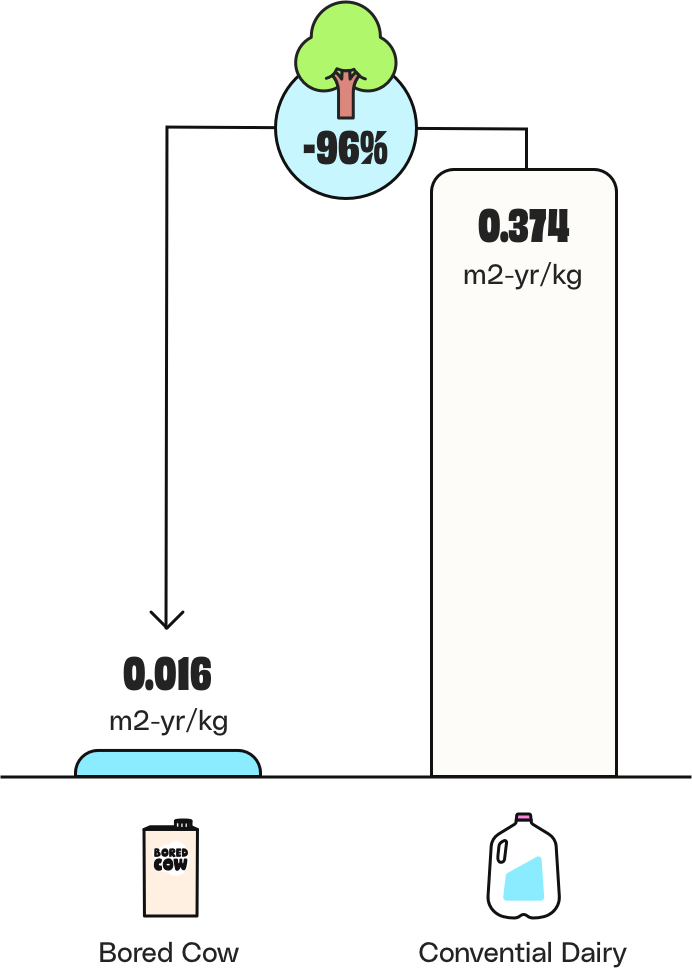
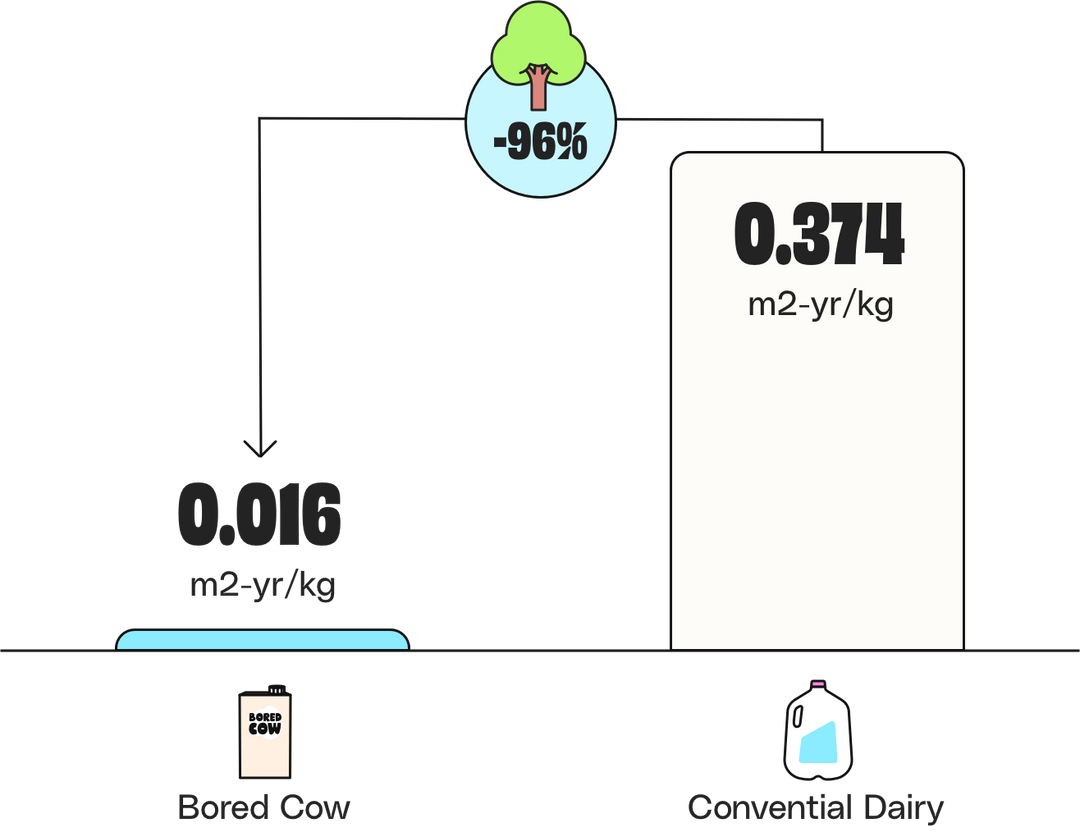
Up to 96% Less Land
From farm to factory, Bored Cow requires up to 96% less land than conventional and organic dairy milk.
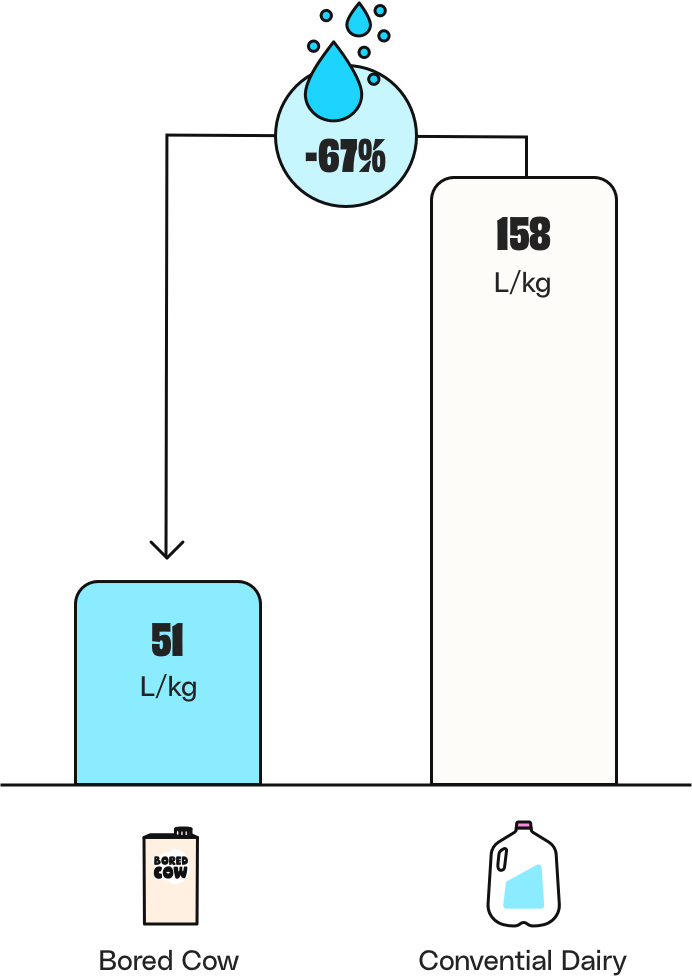
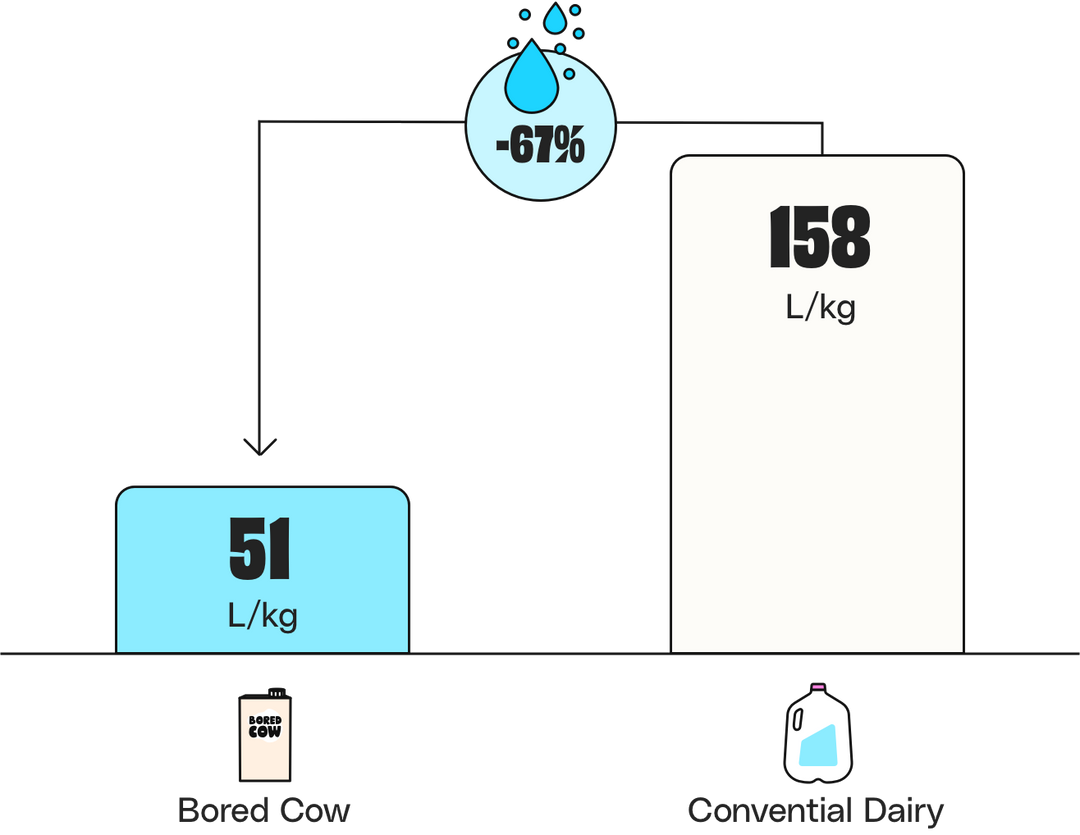
Up to 67% Less Water
From farm to factory, Bored Cow uses up to 67% less water than conventional and organic dairy milk.
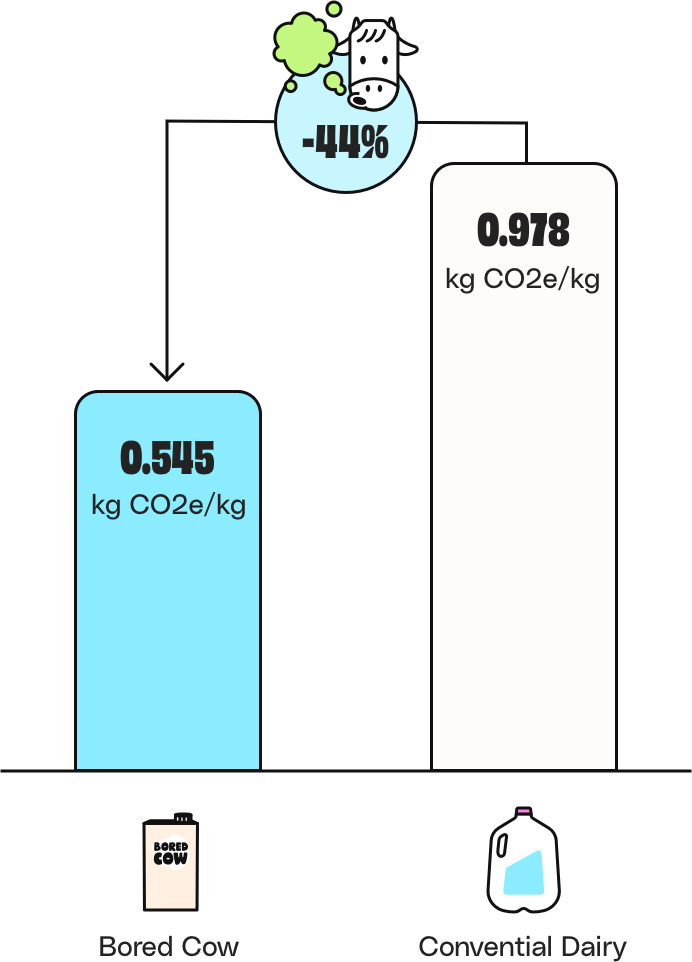
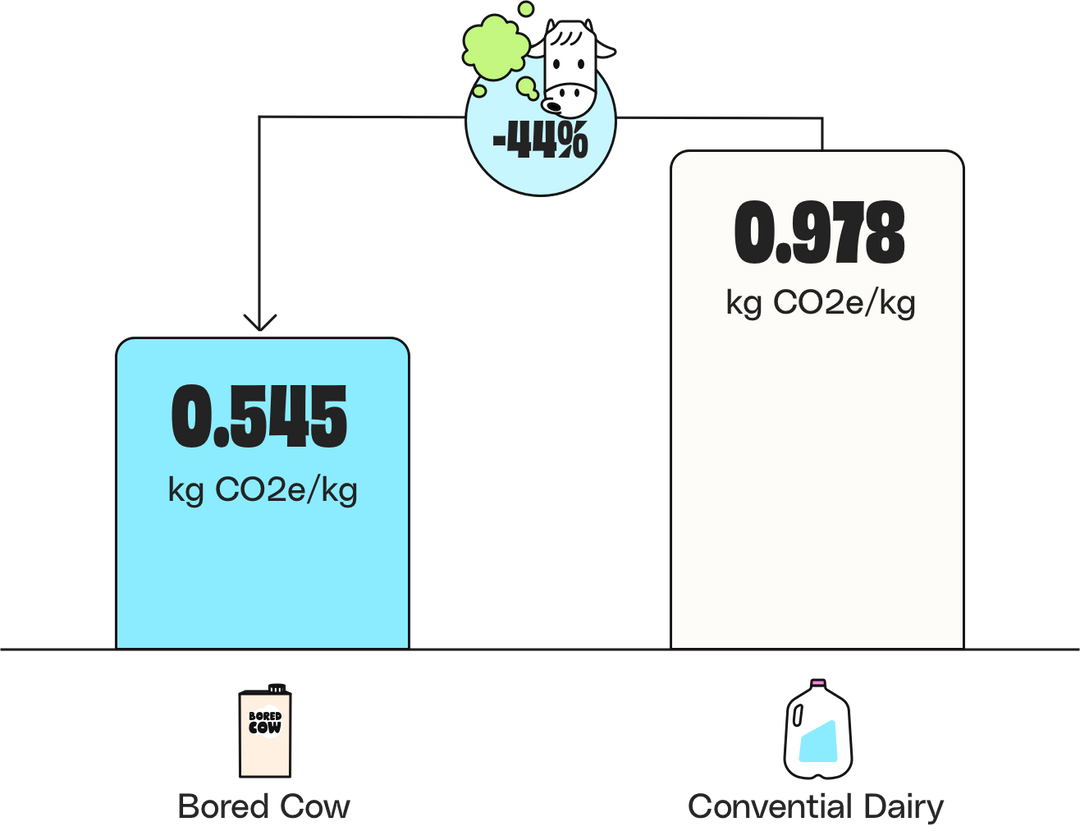
Up to 44% Fewer Emissions
From farm to factory, Bored Cow generates up to 44% fewer emissions than conventional and organic dairy milk.
What is an LCA?
A life cycle assessment, or LCA, measures the environmental impact of a product over all, or a portion, of its lifespan. It covers everything from the materials and ingredients used to make it, to the energy used to transport and manufacture it. LCAs are conducted by independent, third party organizations.
Why do an LCA?
Without a life cycle assessment, there’s really no way to know how much the things we produce and consume are impacting the planet. The first step to reducing our global climate footprint is to understand what is having the biggest impact, and why that is.
WHAT does an LCA MEASURE?

Ingredients
Ingredients like citrus fiber, cane sugar, and cocoa all require land, water, and energy to produce.

Packaging
Packaging materials like cartons, caps, and boxes also require land, water, and energy to produce.
Production
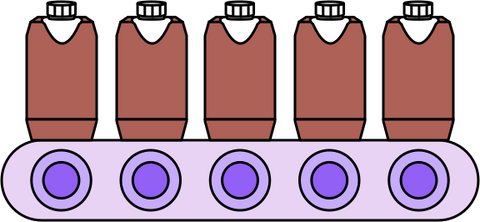
The machines used on the line during the manufacturing process use energy and create emissions.
Distribution
The trucks that transport Bored Cow to warehouses and grocery stores have a climate footprint too.
Consumer Use
You also leave a climate footprint when you buy, transport, store, and consume Bored Cow.
End-of-life
Recycling your Bored Cow carton also leaves a climate footprint, and so does throwing it away.
THE RAW NUMBERS
If you're curious about how Bored Cow compares to other products you love, here are the numbers!
Cradle-to-gate (excluding packaging)
Greenhouse Gas Emission Intensity
Cradle-to-grave
Greenhouse Gas Emission Intensity


Emissions breakdown
Knowing where our emissions come from helps us reduce them!
-
Ingredients (48.0%)
-
production (5.3%)
-
distribution (35.8%)
-
Consumer use (1.2%)
-
packaging (8.8%)
-
end-of-life (0.9%)

made by tomorrow farms, measured by planetfwd
We partnered with carbon assessment platform PlanetFWD to measure Bored Cow’s environmental impact from farm to factory. It’s just one small part of our larger sustainability efforts at Tomorrow Farms.

Proudly B-Corp Certified
That means we’ve met the highest standards for social and environmental performance. And we’re just getting started.
